Transaction log is a file with .ldf file extension that tracks every transaction performed on a database. It is an essential part of a database.
There are three recovery models a database can be set to, Simple, Bulk-logged and Full. These models define how the transaction log behaves.
In the Simple Recovery Model, transaction history is purged once the transaction is completed and a checkpoint is performed (typically, a checkpoint runs every minute).
Pros:
- occupies the least storage space of the three models
- minimizes maintenance
Cons:
- no point-in-time restore
When the Bulk-logged Recovery Model is used, SQL Server minimally logs bulk data modifications and insert operations. This is intended for situations involving large inserts, data modifications or index operations, in which you want to avoid performance issues caused by transaction log writing operations.
Pros:
- avoid performance issues during large inserts, updates, index building etc.
Cons:
- no point-in-time restore
When the Full Recovery Model is set, every transaction is fully logged, for the purposes of restoring the database to a specific point in time. This model is used when the database can’t afford any data loss.
Pros:
- point-in-time restore possible
Cons:
- higher storage requirements
- requires ongoing log size management and automated log backups
Useful Queries
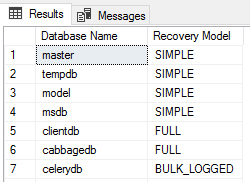
List the Recovery Model for All Databases
SELECT name AS [Database Name],
recovery_model_desc AS [Recovery Model] FROM sys.databases
GO

List only databases in the FULL recovery model
SELECT name, recovery_model_desc FROM sys.databases where recovery_model_desc='FULL';

Size of the transaction log
DBCC SQLPERF(logspace)
The above is a DBCC (Database Console Command) that displays the current size of the transaction logs, along with the percentage of log space used for each database.

We can combine this command with sys.master_files view to get all the relevant info in one place.
DECLARE @LogSpace TABLE (
DatabaseName sysname,
LogSizeMB float,
LogSpaceUsedPercent float,
Status int
);

INSERT INTO @LogSpace
EXEC ('DBCC SQLPERF(logspace)');

SELECT
ls.DatabaseName,
mf.name AS LogFileName,
ls.LogSizeMB,
ls.LogSpaceUsedPercent
FROM @LogSpace ls
JOIN sys.master_files mf
ON ls.DatabaseName = DB_NAME(mf.database_id)
WHERE mf.type_desc = 'LOG'
ORDER BY ls.LogSizeMB DESC;
Here, we create a temporary table variable @LogSpace containing all the necessary data for a clear view of the transaction logs sizes.

Truncate the transaction log
Finally, if needed, we can truncate the transaction log. For databases using the full recovery model, the transaction log is truncated by running a transaction log backup. The preferred approach is to automate log backups.
For databases in the simple recovery model, we can do this ad hoc, using the query:
ALTER DATABASE DatabaseName SET RECOVERY SIMPLE
GO
ALTER DATABASE DatabaseName SET RECOVERY FULL
GO
USE DatabaseName
GO
DBCC SHRINKFILE(LogFileName, 1)
GO
ALTER DATABASE DatabaseName SET RECOVERY SIMPLE
GO
Monitor the size of transaction logs with custom Prometheus metrics
We can configure alerting for large transaction logs using Prometheus. The metrics get exported by windows_exporter, an exporter designed for Windows machines. Once exported to a text file, metrics get scraped by a Prometheus instance.
One of the requirements is a simple PowerShell script that exposes our custom metrics via the textfile collector. In this example, we name the metrics `transaction_logs_truncate_needed`.
The PowerShell script is located in C:\Program Files\windows_exporter\custom_scripts\SQLTransactionLogs.ps1
$dbLog = $null
$dbLog = Get-ChildItem -Path "C:\Program Files\Microsoft SQL Server\*\MSSQL\DATA" -Filter "*.ldf" -Recurse |
     Where-Object { $_.Length -gt 4096MB } |
     Select-Object -ExpandProperty Name
if ($dblog -ne $null) {
     Set-Content -Path 'C:\Program Files\windows_exporter\textfile_inputs\SQLtransactionlogs.prom' -Encoding Ascii -Value "transaction_logs_truncate_needed 1"
     }
     else {
     Set-Content -Path 'C:\Program Files\windows_exporter\textfile_inputs\SQLtransactionlogs.prom' -Encoding Ascii -Value "transaction_logs_truncate_needed 0"
     }
We create a scheduled task that runs the script every 6 hours, starting at 2:00 AM.
$taskname = "Prometheus SQLTransactionLogs Need Check"
$taskdescription = "expose metrics to the text file for Prometheus scraping"
$user = "MACHINE\user"
$action = New-ScheduledTaskAction -Execute 'C:\Windows\System32\WindowsPowerShell\v1.0\powershell.exe' -Argument '-File "C:\Program Files\windows_exporter\custom_scripts\SQLTransactionLogs.ps1"'
$trigger = New-ScheduledTaskTrigger -Once -At 02:00AM -RepetitionInterval (New-TimeSpan -Hours 6)
$settings = New-ScheduledTaskSettingsSet -ExecutionTimeLimit (New-TimeSpan -Hours 1)
Register-ScheduledTask -Action $action -Trigger $trigger -TaskName $taskname -Description $taskdescription -Settings $settings -User $user -RunLevel Highest -Force
Start-ScheduledTask -TaskName 'Prometheus SQLTransactionLogs Need Check'
The PowerShell script outputs metrics to the .prom file located at C:\Program Files\windows_exporter\textfile_inputs\SQLtransactionlogs.prom. Depending on whether there is a log larger than 4 GB, the .prom file content is
transaction_logs_truncate_needed 1
or
transaction_logs_truncate_needed 0
respectively.
Once the metrics are scraped by Prometheus, an alert rule can be triggered. We use Alertmanager to handle alerts, and the rule we set is:
--------------------
groups:
- name: SQLTransactionLogs
  rules:
  - alert: TransactionLogsTruncateNeeded
    expr: transaction_logs_truncate_needed == 1
    for: 30s
    annotations:
      summary: Transaction logs on `{{ $labels.instance }}`
      description: "Transaction logs need check"
      runbook_url: https://wiki.plus.hr/How+To+Truncate+Transaction+log+on+SQL+Server
    labels:
      severity: warning


